


Articles/Essays – Volume 49, No. 2
Youth Suicide Rates and Mormon Religious Context: An Additional Empirical Analysis
Much has been discussed and written regarding whether or not the rate of LGBT youth suicides[1] in the Mormon community has risen in the wake of the November 2015 handbook policy change that categorizes same-sex married couples as “apostates” and forbids baptism to children in same-sex married households.[2] While there is a great deal of anecdotal evidence supporting this connection, more rigorous empirical data are harder to come by.
In an attempt to address this shortage, my colleagues Daniel Parkinson, Michael Barker, and I have presented a wide range of evidence examining direct, indirect, and anecdotal evidence examining the relationship between Mormon culture/norms/rhetoric and youth suicide rates in the Mormon community, especially among LGBT youths.[3] We conclude that while there is little direct evidence available to be able to conclusively demonstrate that a Mormon environment results in higher levels of youth LGBT suicides, there is sufficient indirect and anecdotal evidence that, when combined with what direct evidence is available, strongly points to a link between these factors.
One of the data points we present in our article is the rate of suicide among youth aged fifteen to nineteen in Utah compared to other comparable states over the past several years. We argue: “Suicide is the number one cause of death of all Utah youth; this is not the case nationally More alarming, the teen suicide rate in Utah has doubled since 2011. . . . While Utah had a doubling of suicides among teens, the rest of the country did not see a substantial increase in their suicide rate.”[4]
This evidence is important and, when considered in light of the other evidence they present, certainly supports the argument that the approach to LGBT issues in the LDS Church are influencing suicide rates among young Mormons. Nevertheless, the analysis is also somewhat limited in that we cannot be certain, as we readily admit, that this relationship is not spurious. That is, it is also possible that there are other factors which happen to be present in Utah that also affect youth suicide rates aside from Mormon religious context on LGBT issues that are more likely to be driving these tragic outcomes. Previous research has identified a number of aggregate factors that affect suicide rates in communities. These include demographic factors like race/ethnicity, age, education, income, and divorce. They also include causes such as population density, altitude, rates of mental illness, and gun ownership.[5]
When there are multiple possible factors associated with a particular outcome (such as youth suicide rates), it is possible to control for these factors by using a statistical tool called “multivariate regression analysis.”[6] In essence, a regression analysis can identify the unique and independent effects of one factor on another while simultaneously controlling for the effect of all the other factors that could also be contributing. Think of it as a set of overlapping circles in a Venn diagram: some circles (possible causal factors) overlap with each other to one degree or another. The multivariate regression analysis can identify the independent effect of the portion of each circle (factor) that has no overlap with any other circle. In this case, we can examine more rigorously the relationship we reported by analyzing the prevalence of Mormonism in a community on suicide rates while statistically controlling for these other factors that also contribute to suicide rates such as demographics, gun ownership, and mental illness.
To perform this analysis, I examine the effect of the proportion of individuals in all US states and the District of Columbia that identify as Mormon on the per-capita rates (per 100,000) of suicide among youths in those states aged fifteen to nineteen in both 2009 and 2014, the latter being the latest year that such data are currently available from the Centers for Disease Control.[7][8] I look at both 2009 and 2014 to see if there is a change during that five-year interval as the disconnect between LDS Church rhetoric and societal views on LGBT issues has arguably diverged more strongly in many ways during that time. (See also our other article in this issue that shows that suicide rates in Utah rates were fairly stable in the years leading up to 2009.)
I obtained the percentage of Mormons in each state from the 2014 Pew Religious Landscape Study.[9] I obtained suicide rates from the Centers for Disease Control. The CDC lists suicide rates in a state only if there are more than ten in any particular year, thus some states are excluded from this analysis. In all, the CDC provides sufficient information so that forty-three states are included in the full statistical analysis for 2009, forty-six states are included for 2014, and forty-two are included in the analysis of the rate of change in suicide rates between 2009 and 2014 (more details below). Here we are able to extend the analysis to the majority of all US states to examine whether these trends are generalizable to the entire country.
For the control variables, I include state-level percentages of black, Latino, Asian, bachelor’s degree, divorced, median income (in thou-sands), and median age as given by the 2014 American Community Survey (one-year estimates) as well as state population density (in thousands). I also include the percentage of LGBT population as the research summarized in our other article in this issue shows a link between LGBT identity and suicide risk. These data come from the Gallup organization.[10] Mental health and depression are also associated with suicide rates, and so I also include the serious mental illness rates among the eighteen to twenty-five population (averaged 2013/2014) per thousand, which is obtained from the Department of Health and Human Services.[11] While the eighteen- to twenty-five demographic is not identical to the fifteen-to-nineteen age group under consideration, it is the closest age group currently available from the DHHS. I also included a measure of state spending on behavioral mental health services (per thousand) per fiscal year 2010 as reported by Governing.com[12] as this was shown to be related to suicide rates at the state level.[13] Gun ownership rates per state were obtained from the 2013 national survey.[14] Finally, research has shown that there is a link between state elevation and suicide rates.[15] Given that the states with the highest percentage of Mormon population are also high-elevation states in the Rocky Mountains, I also include a control variable for the average elevation for each state (measured in thousands of feet).[16]
Empirical Analysis
First, Table 1 presents the correlations between the percentage of Mormons in a particular state and the rates of suicide among fifteen- to nineteen-year-olds in 2009, 2014, and the rate of change in suicide rates in each state during that five-year interval.
Bivariate Correlation Results
| % Mormon | 2009 youth suicide rate | 2014 youth suicide rate | |
| 2009 youth suicide rate | 0.01 | ||
| 2014 youth suicide rate | 0.41* | 0.70* | |
| 5-year rate of change, 2009–2014 | 0.44* | -0.21 | 0.48* |
The numbers in Table 1 are “correlation coefficients” and indicate how closely associated two particular variables are. In social and demo-graphic research, a correlation between 0.30 and 0.50 is considered “moderate to substantial.”[17] An asterisk (*) indicates that the relationship is “statistically significant,” meaning that there is a 95 percent chance that the relationship we observe is real and not due to random sampling error. In other words, relationships that are not statistically significant may simply have appeared at random.[18]
Here we see that there is no statistically significant relationship between the proportion of Mormons in a state and suicide rates among youths aged fifteen to nineteen in 2009. We do see, though, that there is a positive and statistically significant relationship between the two in 2014. This means that suicide rates for fifteen- to nineteen-year-olds in 2014 were higher in states where there was a higher proportion of self-identified Mormons. Note also that the correlation is 0.41, which is a moderately strong relationship for social and demographic variables. We also see a similar correlation between the percentage of Mormons in a state and the rate of increase in suicide rates in a state between 2009 and 2014. This means that the more Mormons there are in a state, the faster the youth suicide rate increased over a five-year period, regardless of the objective levels of suicide rates in both 2009 and 2014.
To examine this visually, consider the following graphs. Figure 1 [Editor’s Note: See PDF, p. 32, for Figure 1] presents per-capita age fifteen to nineteen suicide rates in 2009 and 2014 among all US states for which CDC data are available (i.e., higher than ten suicides per 100,000). The states are ranked left to right in order of proportion of Mormon residents. Note that on the left side of the graph (the states with the highest percentage of Mormons), the difference between the grey bars (youth suicides per capita, 2009) and black bars (youth suicides per capita, 2014) is substantial. Then compare with the bars in the rest of the graph. States with the highest percentage of Mormons tend to have much higher objective youth suicide rates in 2014 as well as higher increases in youth suicide rates over the five-year period.
Next, consider the information presented in Figure 2 [Editor’s Note: See PDF, p. 33, for Figure 2], which plots the percent change in youth suicide rates from 2009 to 2014. Observe the obvious trend line: fi ve-year changes in youth suicide rates increase as a state has an increasingly high proportion of Mormon residents.
As stated previously, we must remember that “correlation does not imply causation.”[19] There could be other factors correlated with both the percentage of Mormons in a state as well as suicide rates for high school-aged youths in states, making the relationship between the two spurious.
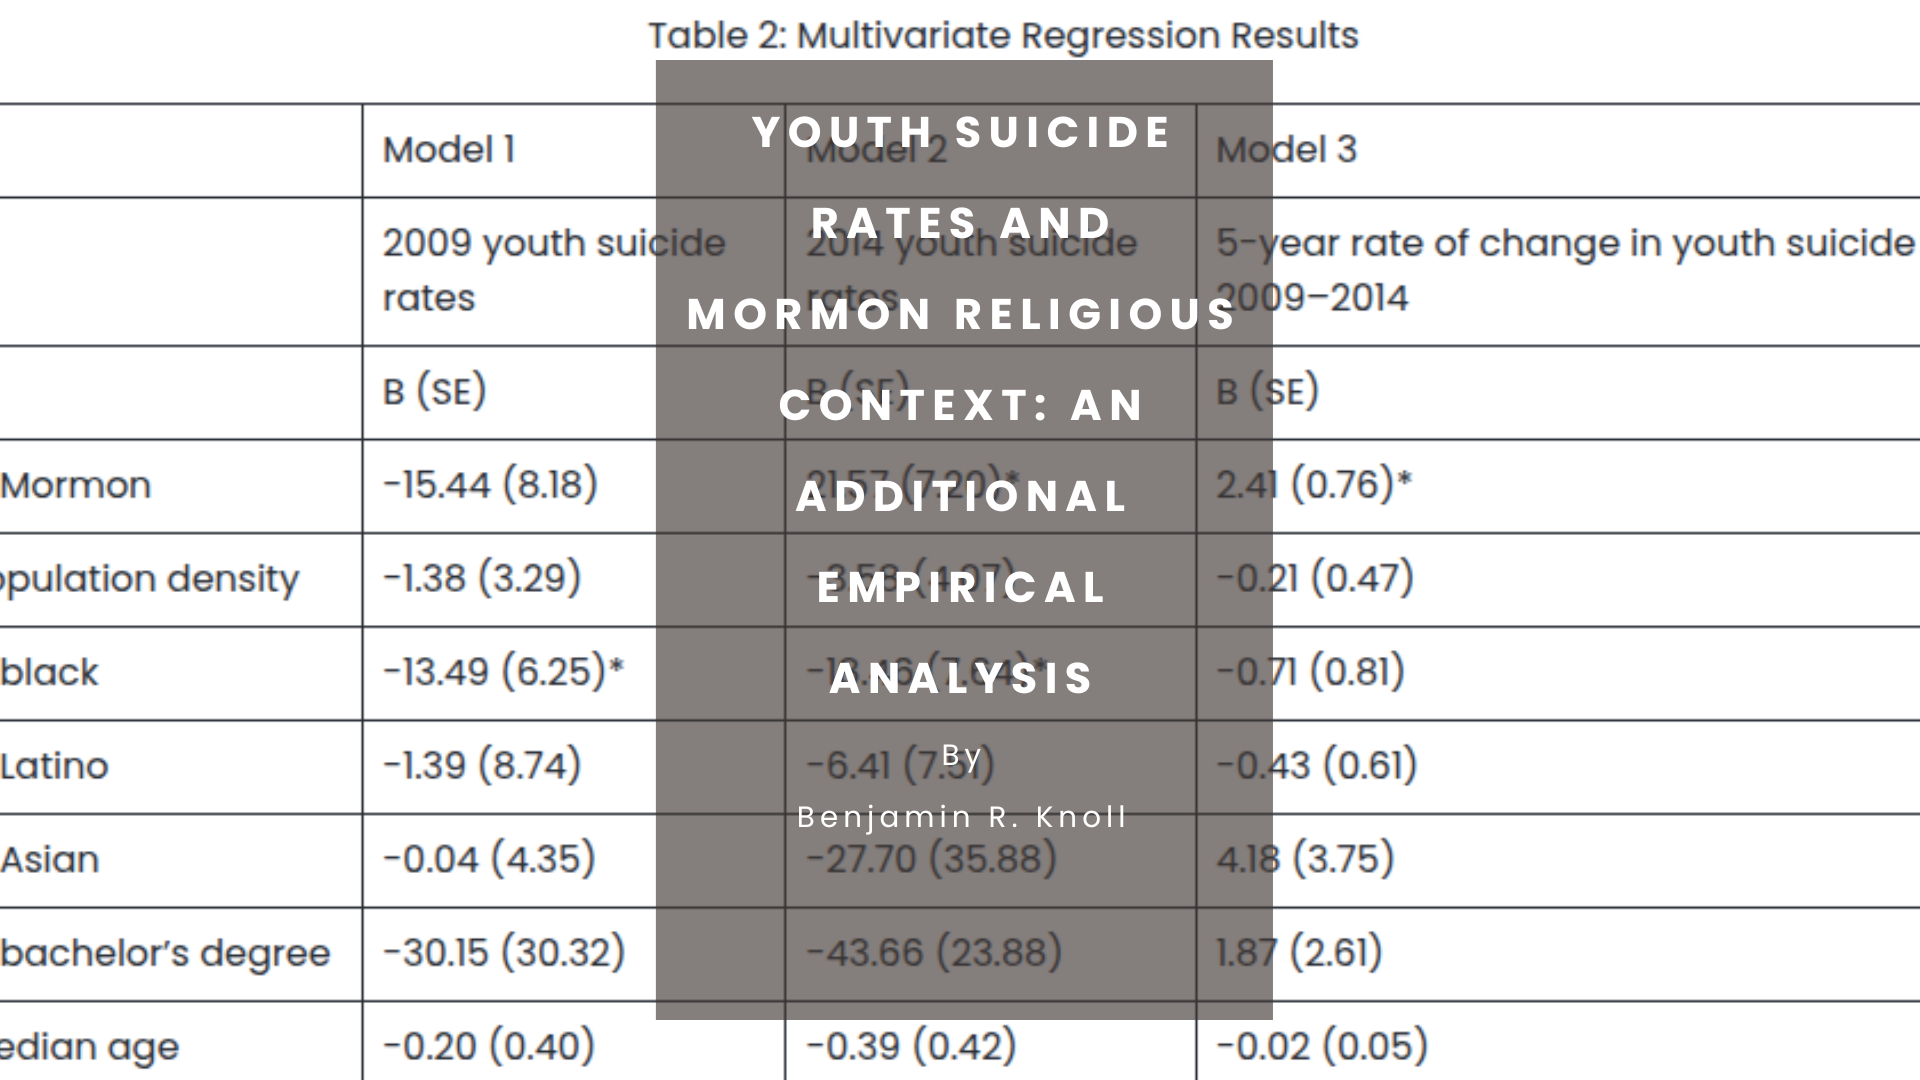
Thus, Table 2 presents the results of three multi-variate regression analyses, which determine the association between the percentage of Mormons in a state and youth suicide rates in 2009, 2014, and the five-year rate of change between them.[20]
Table 2: Multivariate Regression Results
| Model 1 | Model 2 | Model 3 | |
| 2009 youth suicide rates | 2014 youth suicide rates | 5-year rate of change in youth suicide rates, 2009–2014 | |
| B (SE) | B (SE) | B (SE) | |
| % Mormon | -15.44 (8.18) | 21.57 (7.20)* | 2.41 (0.76)* |
| Population density | -1.38 (3.29) | -3.58 (4.07) | -0.21 (0.47) |
| % black | -13.49 (6.25)* | -18.46 (7.64)* | -0.71 (0.81) |
| % Latino | -1.39 (8.74) | -6.41 (7.51) | -0.43 (0.61) |
| % Asian | -0.04 (4.35) | -27.70 (35.88) | 4.18 (3.75) |
| % bachelor’s degree | -30.15 (30.32) | -43.66 (23.88) | 1.87 (2.61) |
| Median age | -0.20 (0.40) | -0.39 (0.42) | -0.02 (0.05) |
| Median income | 0.26 (0.39) | 1.30 (0.40)* | 0.00 (0.04) |
| % divorced | -91.39 (47.56) | 75.35 (49.01) | 4.36 (3.93) |
| % gun ownership | 8.69 (8.05) | 25.06 (9.66)* | 0.82 (0.76) |
| % LGBT | -139.90 (68.58)* | 74.17 (121.84) | 18.62 (10.88) |
| Serious mental illness | -22.80 (20.94) | 6.19 (24.95) | -2.67 (2.82) |
| Elevation (altitude) | 0.61 (0.64) | -0.23 (0.63) | -0.08 (0.06) |
| Mental health spending | -0.07 (-.57) | 2.04 (1.13) | 0.05 (0.06) |
| N | 43 | 46 | 42 |
| Adjusted R-squared | 0.761 | 0.785 | 0.504 |
This is what to pay attention to in Table 2:[21]
- There are asterisks next to some variables but not others. As explained before, the asterisks indicate that the variable is “statistically significant,” meaning that we are highly confident (at least 95 percent confident in this case) that the relationship between that variable and the outcome variable (the one at the top of the column) holds even after statistically controlling for the other variables in the analysis. The level of confidence is given in a “p-value” which shows the chance that the relationship is not statistically significant; a p-value of 0.05 corresponds to a 95 percent degree of confidence. Smaller p-values thus correspond to a higher degree of confidence.
- Look at whether the number next to the variable is positive or negative. If it is positive, it means that as that variable increases, so does the outcome variable (in this case, suicide rates). If it is negative, it means that as the variable decreases, the outcome variable (suicide rates) increases.
First, these results indicate that the proportion of Mormons living in a state is not associated with a higher level of increase in youth suicide rates in 2009, as observed earlier with the correlation analysis.[22]
Second, even after statistically controlling for a host of other relevant variables, such as demographics, state density, gun ownership, elevation, serious mental illness, etc., the proportion of Mormons in a state is associated with higher levels of youth suicide rates in 2014 (p=0.005). Figure 3 [Editor’s Note: See PDF, p. 37, for Figure 3] shows that, controlling for all these other factors, youth suicide rates increase from 11.1 per 100,000 to 22.9 per 100,000 as the percentage of Mormons moves from its minimum in a state (less than 1 percent) to its maximum in a state (55 percent in Utah). These are objectively small numbers, but it means that (again, controlling for other factors) youth suicides are more than twice as high in states with the highest levels of Mormon residents compared to states with the lowest levels of Mormon residents.[23]
By way of comparison, the effect of gun ownership on youth suicide rates is roughly a factor of four, specifically an increase from 4.5 to 18.5 per 100,000 as the levels of gun ownership go from their lowest to highest value. Again, to compare, this means that the effect of percentage of Mormons in a state on youth suicide rates is about half that of gun ownership, or in other words, Mormon prevalence in US states doubles youth suicide rates while gun ownership roughly quadruples them.
Third, even after statistically controlling for a host of other relevant variables such as demographics, state density, gun ownership, serious mental illness, etc., the proportion of Mormons in a state is associated with faster increases in the rate of youth suicides over a five-year period between 2009 and 2014 (p=0.004). Figure 4 [Editor’s Note: See PDF, p. 37, for Figure 4] shows that the rate of change in youth suicides in a state moves from 15.6 percent to 148.4 percent as a state moves from less than 1 percent Mormon to 55 percent Mormon. As we describe in our other article in this issue, suicide rates among Utah youth more than doubled over this five-year period. It is also notable that there are no other factors that reliably predict increases in youth suicide rates during that same time period except for the percentage of Mormons in a given state.
Important Caveats
It is important to specify what this analysis does not say. As we explained in our companion article, it is nearly impossible to accurately measure the sexual orientation of those who commit suicide (as sexual orientation is not included on death certificates). We therefore cannot definitively say one way or the other that the youth suicides recorded by the CDC and used in this analysis are LGBT individuals.
Because this analysis relies on aggregate data, we also cannot definitely say one way or the other what the religious identification of those youths is who committed the suicides reported by the CDC. It may or may not be the case that those youth are Mormons; we cannot say for sure based on this evidence because individual relationships cannot be inferred from aggregate patterns.[24] It is impossible to definitely know from these data, for example, whether a higher percentage of Mormons in a community is associated with more Mormon youth suicides or whether a higher percentage of Mormons in a community is associated with higher non-Mormon youth suicide rates.
Further, these data come only from 2009 and 2014 so we cannot say anything definitive from this evidence alone about the effect of the November 2015 handbook policy change on youth suicide rates in Mormon communities. Only after the CDC reports youth suicide rates for 2015 and 2016 will we be able to speak specifically to that topic.
As an additional check, I repeated each of the correlational and regression analyses presented above, substituting the percentage of Evangelicals and the percentage of weekly church attendance for Mormons. This was to see whether the effects shown above also applied to other religious traditions with conservative LGBT rhetoric and perspectives (percent Evangelical) or whether they applied to religious environments in general (percent weekly church attendance). Neither the percentage of Evangelicals nor the percentage of weekly church-attendance are associated with the three youth suicide variables analyzed above. Further, neither of these variables is predictive of an increase in youth suicides when substituted for the percentage of Mormons in the regression analyses displayed above.[25]
As a final check, I repeated the analyses above, excluding the cases of Utah, Idaho, and Wyoming as they have the highest percentage of Mormon populations in the country (55 percent, 19 percent, and 9 percent respectively as per the Pew 2014 Religious Landscape Study). This was done to determine whether the “outlier” status of Utah, Idaho, or Wyoming was exerting a disproportionate effect on the results of the analysis (all other states have a population of 5 percent or less). When these three states are excluded, the percentage of Mormons is not associated one way or the other with youth suicide rates in 2009, similar to when those states are included. The association in 2014, however, remains somewhat statistically significant (p=0.075). In other words, there is evidence that the relationship between the percentage of Mormons in a community and youth suicide rates in 2014 is still present even when excluding Utah, Idaho, and Wyoming.
As far as the percentage of change in youth suicide rates from 2009 to 2014, excluding Utah, Idaho, and Wyoming from the analysis removes association between Mormon context and five-year rate of change in youth suicide rates. Thus, it appears that the association between the percentage of Mormons and rates of five-year change in youth suicide rates is due exclusively to the relationship specifically in Utah, Idaho, and Wyoming.[26]
Summary
While any empirical analysis has its limitations, what seems evident from the findings described above is this:
- In 2014, a higher proportion of Mormons in a state was associated with a higher level of suicides among those aged fifteen to nineteen in that state, controlling for a host of other relevant factors that are also linked to aggregate suicide rates. All other things being equal, the presence of Mormon residents in a state more than doubles the rate of youth suicides as the rate of Mormon residents moves from its minimum to maximum value. There is some evidence that this is the case even when excluding Utah, Idaho, and Wyoming.
- This association did not exist in 2009.
- The proportion of Mormons in a state is the only factor of all those included in the analysis (including factors most commonly identified as contributing to suicide rates) that is associated with an increase in the rate of youth suicides between 2009 and 2014. As Mormons move from their minimum to maximum population in a state, the rate of increase in high-school-aged suicides moves from 15.6 percent to 148.4 percent. In other words, the more Mormons there are in a state, the faster suicide rates increased between 2009 and 2014. Further analysis indicates that this effect is due primarily to the rate of change in Utah, Idaho, and Wyoming—the three states with the highest Mormon population in the United States.
I stress again that because the CDC does not track the sexual orientation of suicide victims, this evidence does not and cannot show a definitive link between Mormon religious context and LGBT youth suicide rates in the United States. The link between the LDS approach to LGBT issues and LGBT youth suicides is only inferred by these results. This analysis should also in no way be considered the final or definitive word on the topic. While every attempt has been made to identify the relevant factors linked to youth suicide rates in the United States and include them where available in this analysis, it is entirely possible that there is yet some other factor linking these two phenomena together aside from the environment that the LDS Church fosters regarding LGBT issues. Interested observers should offer plausible alternative explanations for this observed relationship and then empirically test them with rigorous social science methodologies, as this is how scientific knowledge is produced. Given the tragic and sensitive nature of this topic, I would think that we should all hope to find support for alternative explanations with additional study, research, and analysis.
In the absence of a compelling alternative explanation and/or evidence, however, the link between LDS rhetoric and approaches to LGBT issues is, in my judgment, the most plausible and compelling offered to date. While these results can only be inferred to support the LDS-LGBT explanation, my colleagues and I have provided a plethora of additional direct, indirect, and anecdotal evidence in our companion article that supports the theorized linking mechanisms for the LDS-LGBT explanation. The evidence presented here provides an additional data point that supports the theorized relationship, making it increasingly difficult (yet not impossible) to reasonably argue that the recent increase in suicides among Mormon LGBT youths are unrelated to the religious context fostered by the LDS Church and its leaders toward the LGBT community.
As a final note, this information and analysis are not intended to condemn, denounce, or “cast stones.” Rather, my objective is to contribute to the conversation on this important topic that quite literally has life-and-death implications. It is clear that there is a problem. The more information we have available to us about its causes, the more effective we can be at crafting an effective solution.
Editor’s Note: The Dialogue Foundation provides the web format of this article as a courtesy. There may be unintentional differences from the printed version. For citational and bibliographical purposes, please use the printed version or the PDFs provided online and on JSTOR.
Author’s Note: A previous version of this article originally appeared as a blog post by the same name on Rational Faiths, March 9, 2016. In the days following its initial release, several online commenters submitted constructive feedback and questions about the article’s statistical results, presentation, and methodology. This feedback prompted several minor revisions that are reflected in the current version of this article. I extend my sincere thanks to the many commenters for their questions and comments, which helped make the revisions reflected in this version. It is important to note, though, that the substantive results from the original version are unchanged.
[1] Peggy Fletcher Stack, “Suicide Fears, If Not Actual Suicides, Rise in Wake of Mormon Same-Sex Policy,” Salt Lake Tribune, Jan. 28, 2016.
[2] Laurie Goodstein, “Mormons Sharpen Stand Against Same-Sex Marriage,” New York Times, Nov. 7, 2015, A11.
[3] See Barker, Parkinson, and Knoll in this issue.
[4] Ibid.
[5] Leonardo Tondo, Matthew J. Albertt, and Ross. J. Baldessarini, “Suicide Rates in Relation to Health Care Access in the United States: An Ecological Study,” Journal of Clinical Psychology 67, no. 4 (2006): 517–23; Namkug Kim, Jennie B. Mickelson, Barry E. Brenner, Charlotte A. Haws, Deborah A. Yurgelun-Todd, and Perry F. Renshaw, “Altitude, Gun Ownership, Rural Areas, and Suicide,” The American Journal of Psychiatry 168, no. 1 (2011): 49–54; Matthew Miller and David Hemenway, “Guns and Suicide in the United States,” New England Journal of Medicine 359 (2008): 989–91.
[6] Larry D. Schroeder, David L. Sjoquist, and Paula E. Stephan, Understanding Regression Analysis: An Introductory Guide (New York: Sage, 1986); Amy Gallo, “A Refresher on Regression Analysis,” Harvard Business Review, Nov. 4, 2015.
[7] These data are from the “Injury Prevention & Control: Data & Statistics: Web-based Injury Statistics Query and Reporting System,” Center for Disease Control and Prevention.
[8] Suspecting that suicide rates among the fifteen to nineteen age group might represent an overly narrow segment of the youth population, I repeated all these analyses for state suicide rates among the ten to twenty-nine age group in each state and the link between the percentage of Mormons and suicide rates disappeared entirely. This means that the link between the percentage of Mormons in a state and youth suicide rates is limited specifically to the high-school-aged group fifteen to nineteen.
[9] These data are from the “Religious Landscape Study,” PEW Research Center, Religion and Public Life.
[10] Gary J. Gates and Frank Newport, “LGBT Percentage Highest in D.C., Lowest in North Dakota,” Gallup, Feb. 15, 2013.
[11] These data are from the “Population Data / NSDUH,” Substance Abuse and Mental Health Services Administration, United States Department of Health and Human Services.
[12] These data are from “Mental Health Spending: State Agency Totals,” Governing: The States and Localities.
[13] Tondo, et al., “Suicide Rates in Relation to Health Care Access,” 517–23.
[14] Bindu Kalesan, Marcos D. Villarreal, Katherine M. Keyes, and Sandro Galea, “Gun Ownership and Social Gun Culture,” Injury Prevention, 2015.
[15] Barry Brenner, David Cheng, Sunday Clark, and Carlos A. Camargo, Jr., “Positive Association between Altitude and Suicide in 2,584 U.S. Counties,” High Altitude Medicine & Biology 12, no. 1 (2011): 1–5.
[16] I originally also included the percentage of weekly church-going in each state as a control variable on the logic that environments that are more religious in general would also possibly contribute to youth suicide rates. This variable was removed, though, due to multi-collinearity as percent-Mormon and percent-weekly church-going are very highly correlated. This is a standard solution to dealing with a multi-variate analysis when two or more variables are highly correlated. See David A. Belsley, Edwin Kuh, and Roy E. Welsch, Regression Diagnostics: Identifying Influential Data and Sources of Collinearity (John Wileyand Sons, 1980). I also originally included the percentage of rural population in each state as per the 2010 Census as research has shown that suicide rates tend to be higher in rural areas. See Jameson K. Hirsch, “A Review of the Literature on Rural Suicide,” Crisis 27, no. 4 (2006): 189–99. Again, this caused an unacceptable amount of multi-collinearity in the model as the percentage rural is very highly correlated with several of the other variables in the model (specifically percentage Latino, percentage Asian, median income, percentage of bachelors’ degrees, and percentage of gun ownership) and thus percentage rural is not included in these models.
[17] David de Vaus, Analyzing Social Science Data: 50 Key Problems in Data Analysis (New York: Sage, 2002).
[18] For a more comprehensive explanation, see “What Does Statistically Significant Mean?” MeasuringU.
[19] Herbert A. Simon, “Spurious Correlation: A Causal Interpretation,” Journal of the American Statistical Association 49, no. 267 (1954): 467–79.
[20] A Breusch–Pagan/Cook–Weisberg test revealed an unacceptable amount of heteroscedasticity in all three models and so robust standard errors are used as a corrective in each case. After excluding the variables that contributed to multi-collinearity (see n 16), VIF scores for each model were all in the acceptable range of less than 4.0.
[21] For a primer on how to interpret regression statistics, see Jim Frost, “How to Interpret Regression Analysis Results: P-values and Coefficients,” The Minitab Blog, Jul. 1, 2013.
[22] If anything, there is some weak evidence that a higher percentage of Mormons in a state is actually associated with a lower proportion of youth suicide rates in 2009 as the significance value for that variable is p=0.07 in Model 1.
[23] Note also the lines around each of the points in Figures 3 and 4 which indi-cate the “confidence intervals” or “margin of error.” This is the range for which we are 95 percent confident that the relationship between the two variables is present. Due largely to the decreasing number of states with a high percentage of a Mormon population, the margin of error gets higher as the percentage of Mormons increases.
[24] Inferring individual-level relationships from aggregate patterns is called the “ecological fallacy.” This is a common misinterpretation of statistical data where one assumes that a relationship present in a group or community applies at the individual level. As a very basic example, we might observe that a particular neighborhood is 50 percent female and 50 percent Democratic and assume that each female is also a Democrat when in reality we cannot tell from only the aggregate information. It may also be the case that half of the females (25 percent of the whole) are Democrats and 25 percent of the males (25 percent of the whole) are also Democrats. The 25 percent female Democrats plus 25 percent male Demo-crats equal 50 percent Democrats in the whole, which is a very different pattern than our original assumption, which was based only on aggregate patterns. See Steven Piantadosi, David P. Byar, and Sylvan B. Green, “The Ecological Fallacy,” American Journal of Epidemiology 127, no. 5 (1988): 893–904.
[25] In fact, there is some weak evidence that the percentage of Evangelicals actually decreases the rate of youth suicides in 2014 (p=0.10) and also the five-year rate of change between 2009 and 2014 (p=0.05). This effect, though, could be an artifact of the reality that more Mormons in a state is correlated with fewer Evangelicals in a state. Including both the percentage of Mormons and the percentage of Evangelicals in the regression models leaves both variables statistically insignificant. The variable for the percentage of Mormons in 2014, however, is significant at p=0.013, as are the percentage of Mormons and five-year rate of change (p=0.067).
[26] The CDC did not report youth suicide rates for Wyoming in 2009 because the rate was lower than ten per 100,000. To check these results, including/excluding Utah, Idaho, and Wyoming, I generated a conservative estimate for the 2009 rate at ten in Wyoming that would create the lowest possible rate of change.